Attention Oriented Scoring
Let 's imagine that you are a very cool and full of swag rock singer, and you want to broadcast your music videos on the internet. You want to choose a web video broadcast company that ensure you that you will appear a fair-equal number of times in the recommendations that they made to their customers compared to the other rock stars. You have choosen cooltube.com because it has a good reputation to be fair in the sense you are looking for.
However, is cooltube.com showing you a fair number of times in their recommendation system ? Which could be a fair number of appearances in their recommender system ? How we compute such a number ?.
We can model the coolsongs.com recommendation engine output as a table. One column for the query identification number, and another column for a list of artists ids that match that query by order of relevance from left to right . Table 2 shows a table example :
| Query | Rankings |
|---|---|
| 1 | 2,5,7,10,12 |
| 2 | 1,6,7,5,8 |
| 3 | 5,7,9,10,12 |
| 4 | 14,5,10,2,1 |
| 5 | 2,8,9,10,1 |
| 6 | 4,6,7,9,10 |
| 7 | 13,5,9,15,16 |
| 8 | 17,5,6,18,1 |
| 9 | 1,2,3,4,5 |
| 10 | 20,19,18,17,14 |
This table shows the output for 10 different queries. Row one means that the artist with id 2 was the most relevant, and it was shown first, then artist with id 5 and so on.
Recommendation Score for Artists :
From such a table we can define the artist k recommended score (RAk) by:
Where N is the number of artist shown by output (5 in this case), n is the number of rows, and
posi(Ak), is the position on row i that artist k is holding from left to right , being 0 the posi-
tion of the leftmost identifier.
For example in query 5, pos5(Artist9) = 2.
RAk can be used to verify how fair is being coolsongs.com recommendation engine.It measures how
much an artist was shown in the recommendation system in a temporal sequence of queries.
Check the python notebook in order to see how Algorithm 2 computes this score for every artist and
leaves the result in rock_artist dictionnary. Once these scores are computed, you can apply unequality
measures over these scores , like Gini index, Theil index etc, to analyze inequality
Recommendation Score for Sensitive Attributes :
Business also normally have a table with sensitive attributes of artists to detect bias in the recommen- dations :
| # | Age | Gender | Nationality |
|---|---|---|---|
| 1 | 20 | M | national |
| 2 | 52 | F | foreign |
| 3 | 36 | M | national |
| 4 | 25 | F | foreign |
| 5 | 67 | M | national |
| 6 | 45 | F | foreign |
| 7 | 59 | M | national |
| 8 | 23 | F | foreign |
| 9 | 18 | M | national |
| 10 | 56 | F | foreign |
| 11 | 64 | M | national |
| 12 | 35 | F | foreign |
| 13 | 38 | M | national |
| 14 | 63 | F | foreign |
| 15 | 41 | M | national |
| 16 | 72 | F | national |
| 17 | 20 | M | national |
| 18 | 19 | F | national |
| 19 | 29 | M | national |
| 20 | 46 | F | national |
At the same pace we compute RAs, we can compute the sensitive attribute score. Intuitively, if an artist is man and foreigner and it obtained a score of
This same score can be added to the sensitive categories man and foreigner
Formally, for sensitive values {SV1, SV2, SV3, ...SVn} belonging to Sensitive Category SCm ( for example {M an, W omam} ∈ Gender), we can de ne the Sensitive value score SVj like
SVj = Pn i=1(N − posi(Artistk) when Artistk[SCm] == SVj )
Where Artistk[SCm] is the value of the column SCm in artists table
Inspecting the notebook, you can see how Algorithm 2 computes also sensitivity weights and leaves them on counters_sens_attributes variable. Once this is computed, the notebook plots lorentz curves to study unfairness related to sensitive attributes
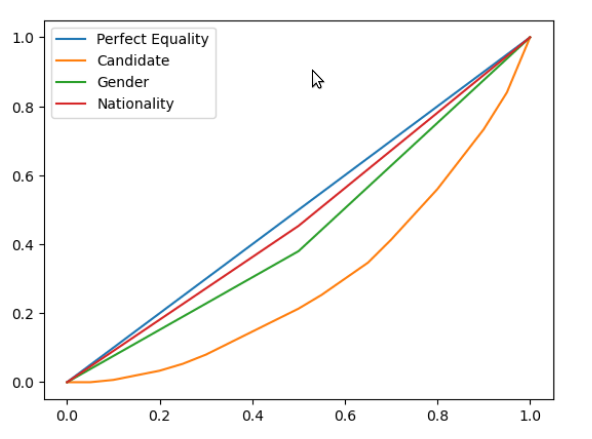
From these curves, we conclude that Gender attribute deserves attention. as is the one that is far from the blue equity line. (Revisar bien esta conclusion, 'nationality': 'foreign': 57, 'national': 93, 'gender': 'F': 68, 'M': 82
